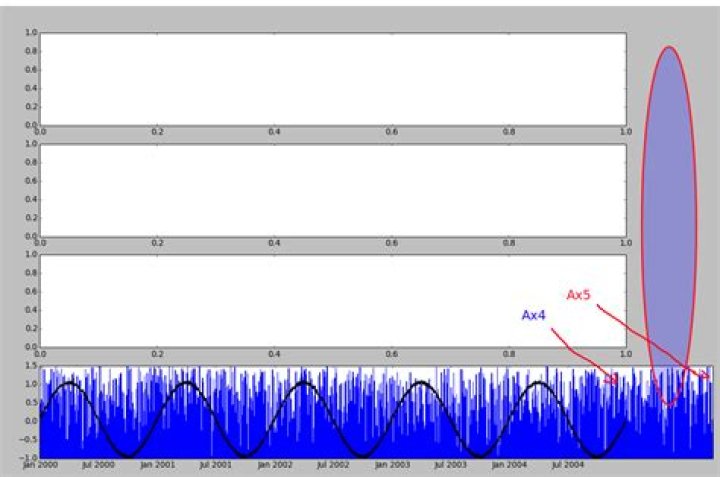
I am trying to plot several subplots in a pyplot figure, one of which has two subplots. I handle this by creating one extra pyplot.ax based on the location of the bottom one.
Now, a problem arise when I adjust axes 1 through 4 using fig.subplots_adjust(), in order to leave an extra space on the right for legend. On the picture below, you can see that although my two datasets are the same length, the bar plot stretches further to the right.
I would like to apply the same adjustment to ax5 as I do to the other four axes when using fig.subplot_adjust(), but I cannot figure out what this method is doing with the matplotlib.axes.Axes instance.
Looking at the documentation, I could not find a method that suits my purpose:
So what is fig.subplot_adjust() doing to my axes? How can I reproduce this behavior so that ALL axes align?
import numpy as np import matplotlib.pyplot as plt import datetime fig, ( ax1, ax2, ax3 , ax4) = plt.subplots( figsize=(18.0, 11.0) , nrows=4, ncols=1) ## some fake stand-alone data days = 365 * 5 dates = [datetime.datetime(2000, 1, 1, 0, 0) + datetime.timedelta( day - 1) for day in range(days)] data_series = np.random.rand( days ) data_series2 = [np.sin(x * 2 * np.pi / 365 ) + np.random.rand(1) * 0.1 for x in range( days ) ] ###### Plots made up temperatures ax4.set_frame_on(False) ax4.plot_date( dates , data_series2 , color="black", ls="solid", lw=2, ms=0 ) # Now on the same plot try to add som precipitation as a plot ax5 = fig.add_axes(ax4.get_position() , frameon=True, zorder = -10.0) ax5.bar( dates, data_series, edgecolor="blue", zorder = -10.0 ) ax5.xaxis_date() # gets rid of bar-plot labels ax5.set_xticks([]); ax5.set_yticks([]) fig.subplots_adjust(right=0.8) # <- Pandora's box plt.show() 
1 Answer
The problem here is that ax5 is not in a subplot.
fig.get_axes() [<matplotlib.axes._subplots.AxesSubplot at 0x220175c0>, <matplotlib.axes._subplots.AxesSubplot at 0x18d48240>, <matplotlib.axes._subplots.AxesSubplot at 0x1c5f3630>, <matplotlib.axes._subplots.AxesSubplot at 0x1a430710>, <matplotlib.axes._axes.Axes at 0x1c4defd0>] # There is ax5 and it is not under _subplots so when you do
fig.subplots_adjust(right=0.8) you adjust the subplot and not the axe directly so you don't affect ax5.
An easy way to correct than is to adjust ax4 before calling ax5, so ax5 will have the same proportion than ax4.
By calling
fig.subplots_adjust(right=0.8) before
ax5 = fig.add_axes(ax4.get_position() , frameon=True, zorder = -10.0) you will get the proper output.
So your code just have to look like that;
import numpy as np import matplotlib.pyplot as plt import datetime fig, ( ax1, ax2, ax3 , ax4) = plt.subplots( figsize=(18.0, 11.0) , nrows=4, ncols=1) ## some fake stand-alone data days = 365 * 5 dates = [datetime.datetime(2000, 1, 1, 0, 0) + datetime.timedelta( day - 1) for day in range(days)] data_series = np.random.rand( days ) data_series2 = [np.sin(x * 2 * np.pi / 365 ) + np.random.rand(1) * 0.1 for x in range( days ) ] ###### Plots made up temperatures ax4.set_frame_on(False) ax4.plot_date( dates , data_series2 , color="black", ls="solid", lw=2, ms=0 ) # I move the subplot_adjust here before you create ax5 fig.subplots_adjust(right=0.8) # Now on the same plot try to add som precipitation as a plot ax5 = fig.add_axes(ax4.get_position() , frameon=True, zorder = -10.0) ax5.bar( dates, data_series, edgecolor="blue", zorder = -10.0 ) ax5.xaxis_date() # gets rid of bar-plot labels ax5.set_xticks([]); ax5.set_yticks([]) plt.show()