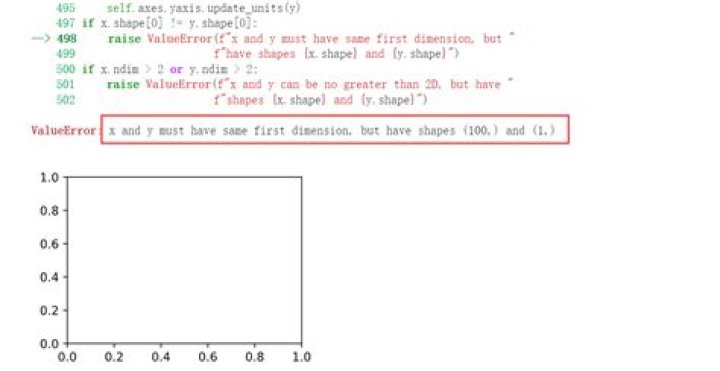
I'm trying to plot a simple function using python, numpy and matplotlib but when I execute the script it returns a ValueError described in the title.
This is my code:
"""Geometrical interpretation: In Python, plot the function y = f(x) = x**3 − (1/x) and plot its tangent line at x = 1 and at x = 2.""" import numpy as np import matplotlib.pyplot as plt def plot(func): plt.figure(figsize=(12, 8)) x = np.linspace(-100, 100, 100) plt.plot(x, func, '-', color='pink') plt.show() plt.close() plot(lambda x: x ** 3 - (1 / x)) Please send this beginer some help :)
31 Answer
This was a good effort actually. You only needed to add the y variable using y=func(x). And then plt.plot(x,y)...
so this works:
import numpy as np import matplotlib.pyplot as plt def plot(func): plt.figure(figsize=(12, 8)) x = np.linspace(-100, 100, 100) y = func(x) plt.plot(x, y, '-', color='pink') plt.show() plt.close() plot(lambda x: x ** 3 - (1 / x)) result: