I have the following data frame. It details the yearly cost of 4 different spending scenarios each with three years.
mydf2 = data.frame( Scenario = c(1,1,1,2,2,2,3,3,3,4,4,4), Year= c(1,2,3,1,2,3,1,2,3,1,2,3), Cost = c(140,445,847,948,847,143,554,30,44,554,89,45)) I want to be able to graph the total yearly cost of all scenarios I have:
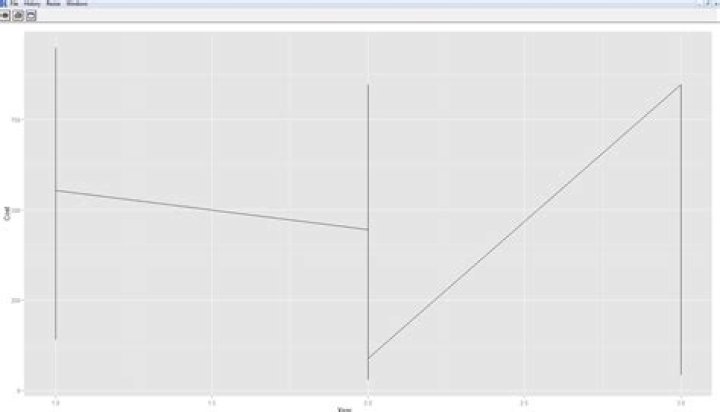
library(ggplot2) ggplot(mydf2, aes(x = Year, y= Cost))+ geom_line(stat="identity") but it produces this terrible looking graph:

When I summarize the data by year it works but I don't know how to do this in R. I have to go back to Excel. How do I summarize the data frame by year so it can be graphed? The new frame will look like this:
Year Total Cost 1 2196 2 1411 3 1079 But again I have to go back to Excel to do it. I don't know why those vertical lines persist either. I am new to R so thanks very much.
21 Answer
The ggplot way to do this is:
ggplot(mydf2, aes(x = Year, y= Cost)) + stat_summary(fun.y = sum, geom = "line") Another option is to use dplyr to summarise the data and "pipe" it right into ggplot.
library(dplyr); library(ggplot2) mydf2 %>% group_by(Year) %>% summarise(Cost = sum(Cost)) %>% ggplot(., aes(x = Year, y = Cost)) + geom_line(stat = "identity") The . inside ggplot is the data that is passed through the pipe with %>%.
If you wanted to make one plot per scenario, you can use facet_wrap for example. I don't use stat_summary here since each scenario has only 1 entry per year i.e. no aggregation necessary:
ggplot(mydf2, aes(x = Year, y= Cost)) + geom_line(stat = "identity") + facet_wrap( ~ Scenario) If you want to plot each scenario with a separate line but in the same plot, you can do:
ggplot(mydf2, aes(x = Year, y= Cost, color = factor(Scenario))) + geom_line(stat = "identity")