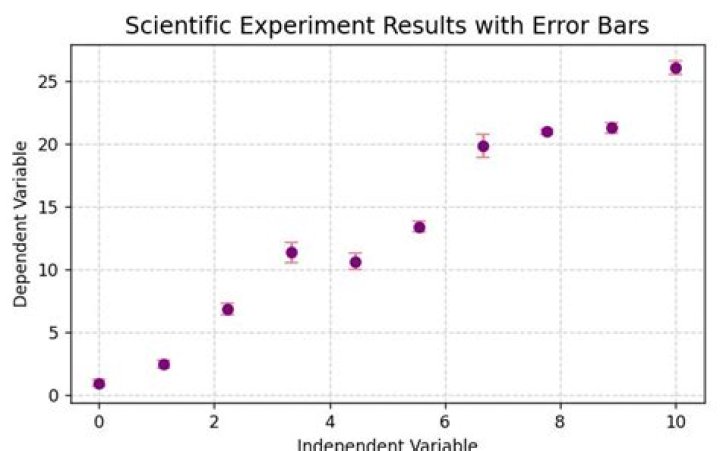
I am attempting a scatter plot of 2 arrays for which I have a third array containing the absolute error (error in y direction) on each point. I want the error bars to between (point a - error on a) and (point a + error on a). Is there a way of achieving this with pylab and if not any ideas on how else I could do it?
02 Answers
This is almost like the other answer but you don't need a scatter plot at all, you can simply specify a scatter-plot-like format (fmt-parameter) for errorbar:
import matplotlib.pyplot as plt x = [1, 2, 3, 4] y = [1, 4, 9, 16] e = [0.5, 1., 1.5, 2.] plt.errorbar(x, y, yerr=e, fmt='o') plt.show() Result:

A list of the avaiable fmt parameters can be found for example in the plot documentation:
character description '-' solid line style '--' dashed line style '-.' dash-dot line style ':' dotted line style '.' point marker ',' pixel marker 'o' circle marker 'v' triangle_down marker '^' triangle_up marker '<' triangle_left marker '>' triangle_right marker '1' tri_down marker '2' tri_up marker '3' tri_left marker '4' tri_right marker 's' square marker 'p' pentagon marker '*' star marker 'h' hexagon1 marker 'H' hexagon2 marker '+' plus marker 'x' x marker 'D' diamond marker 'd' thin_diamond marker '|' vline marker '_' hline marker >>> import matplotlib.pyplot as plt >>> a = [1,3,5,7] >>> b = [11,-2,4,19] >>> plt.pyplot.scatter(a,b) >>> plt.scatter(a,b) <matplotlib.collections.PathCollection object at 0x00000000057E2CF8> >>> plt.show() >>> c = [1,3,2,1] >>> plt.errorbar(a,b,yerr=c, linestyle="None") <Container object of 3 artists> >>> plt.show() where a is your x data b is your y data c is your y error if any
note that c is the error in each direction already
0