According to the documentation, offline mode with plot.ly in Jupyter is supposed to work after calling:
from plotly.offline import download_plotlyjs, init_notebook_mode, iplot init_notebook_mode(connected=True) Now I am trying to show the following plot:
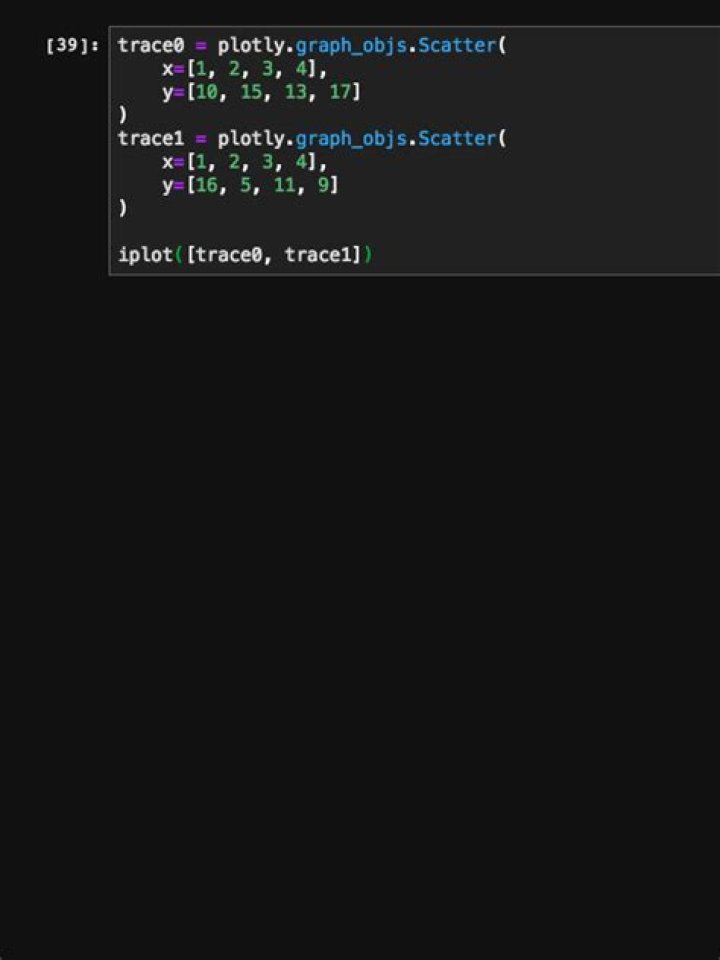
trace0 = plotly.graph_objs.Scatter( x=[1, 2, 3, 4], y=[10, 15, 13, 17] ) trace1 = plotly.graph_objs.Scatter( x=[1, 2, 3, 4], y=[16, 5, 11, 9] ) iplot([trace0, trace1]) The result is much empty space in the cell output area.

Why is this not working with Jupyter Lab?
7 Answers
A couple things might be happening. For some reason is your Notebook "Not Trusted?" This will stop the Plotly javascript from rendering anything below.
Another possibility is that you don't have the Plotly extension installed for Jupyter Lab. In Lab, as compared to Notebooks, there are a lot more restrictions on what javascript can execute, so packages need to have extensions installed in order to display anything beneath the cell.
Look for the plotly-extension with jupyter labextension list
and install it if missing with: jupyter labextension install jupyterlab-plotly
Try changing the renderer:
import plotly.io as pio pio.renderers.default = 'iframe' # or 'notebook' or 'colab' or 'jupyterlab' You can loop through the list like this to see what fits you
import pandas as pd import plotly.express as px import plotly.io as pio for text in pio.renderers: print(text) pio.renderers.default = text df = px.data.iris() fig = px.scatter(df, x="sepal_width", y="sepal_length", color="species") fig.show() Plotly-extension has been deprecated, use another:
jupyter labextension install jupyterlab-plotly it worked for me and it has no compatibility issues with the latest versions of plotly (currently 4.9.0) / jupyterlab
0One way to do it will be using HTML to help JupyterLab show figures. One example will be:
import plotly.express as px from IPython.display import HTML df = px.data.tips() fig = px.scatter(df, x='total_bill', y='tip', opacity=0.65, trendline='ols', trendline_color_override='darkblue') HTML(fig.to_html()) If you are using Jupyter Lab (Not Jupyter Notebook), you need to install "Jupyter Renderers" extension for Jupyter Lab.
check out the similar topics: - Using plot.ly in jupyterlab - graphics does not show - plotly basic example shows no plot in jupyter lab
I had the same problem, but when I tried to run the following code, I received an error:
$ jupyter labextension install jupyterlab-plotly@4.10.0 An error occured. ValueError: Please install nodejs >=10.0.0 before continuing. nodejs may be installed using conda or directly from the nodejs website. But I ran the "node -v" and my version was v6.13.1, that means it was supposed to work.
I found the way to solve my problem through this post >> Conda not recognizing that I have node installed?
I installed as recommended in and it worked well.
I ran all of the following:
conda install -c conda-forge nodejs conda install -c conda-forge/label/gcc7 nodejs conda install -c conda-forge/label/cf201901 nodejs conda install -c conda-forge/label/cf202003 nodejs ' Also, if your Anaconda installed in root directory of Windows, for example: C:\Anaconda\ Then this is what worked for me, because I could not run the jupyter labextension install jupyterlab-plotly from my (base) Python. Therefor, first I ran this in my virtual env: jupyter labextension list Next jupyter labextension install jupyterlab-plotly Once installed and tested in Virtual env, I copied the jupyter-labextension-script.py from Scripts folder under the Virtual Env, and paste it to Scripts folder in my main (Base) Python folder. Now, activate base Next follow these commands: jupyter labextension list Finally jupyter labextension install jupyterlab-plotly
Test your Jupyterlab and you should be able to see your graphs.