I want to plot a graph with one logarithmic axis using matplotlib.
I've been reading the docs, but can't figure out the syntax. I know that it's probably something simple like 'scale=linear' in the plot arguments, but I can't seem to get it right
Sample program:
import pylab import matplotlib.pyplot as plt a = [pow(10, i) for i in range(10)] fig = plt.figure() ax = fig.add_subplot(2, 1, 1) line, = ax.plot(a, color='blue', lw=2) pylab.show() 6 Answers
You can use the Axes.set_yscale method. That allows you to change the scale after the Axes object is created. That would also allow you to build a control to let the user pick the scale if you needed to.
The relevant line to add is:
ax.set_yscale('log') You can use 'linear' to switch back to a linear scale. Here's what your code would look like:
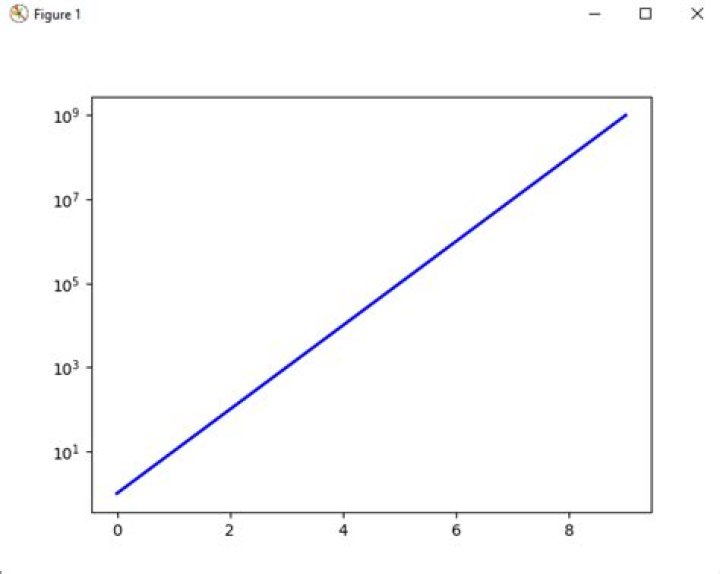
import pylab import matplotlib.pyplot as plt a = [pow(10, i) for i in range(10)] fig = plt.figure() ax = fig.add_subplot(2, 1, 1) line, = ax.plot(a, color='blue', lw=2) ax.set_yscale('log') pylab.show() 
First of all, it's not very tidy to mix pylab and pyplot code. What's more, pyplot style is preferred over using pylab.
Here is a slightly cleaned up code, using only pyplot functions:
from matplotlib import pyplot a = [ pow(10,i) for i in range(10) ] pyplot.subplot(2,1,1) pyplot.plot(a, color='blue', lw=2) pyplot.yscale('log') pyplot.show() The relevant function is pyplot.yscale(). If you use the object-oriented version, replace it by the method Axes.set_yscale(). Remember that you can also change the scale of X axis, using pyplot.xscale() (or Axes.set_xscale()).
Check my question What is the difference between ‘log’ and ‘symlog’? to see a few examples of the graph scales that matplotlib offers.
1You simply need to use semilogy instead of plot:
from pylab import * import matplotlib.pyplot as pyplot a = [ pow(10,i) for i in range(10) ] fig = pyplot.figure() ax = fig.add_subplot(2,1,1) line, = ax.semilogy(a, color='blue', lw=2) show() if you want to change the base of logarithm, just add:
plt.yscale('log',base=2) Before Matplotlib 3.3, you would have to use basex/basey as the bases of log
I know this is slightly off-topic, since some comments mentioned the ax.set_yscale('log') to be "nicest" solution I thought a rebuttal could be due. I would not recommend using ax.set_yscale('log') for histograms and bar plots. In my version (0.99.1.1) i run into some rendering problems - not sure how general this issue is. However both bar and hist has optional arguments to set the y-scale to log, which work fine.
So if you are simply using the unsophisticated API, like I often am (I use it in ipython a lot), then this is simply
yscale('log') plot(...) Hope this helps someone looking for a simple answer! :).