
The objective is to show overlapping histograms, but I want to avoid using the alpha adjustment so that the colours remain bright.
Is there a way to do this without adjusting the alpha arg?
Goal is to display the colors shown below:
hist(rnorm(mean=10, n = 1000), col='blue') hist(rnorm(mean=11, n = 1000), col='red', add=T) 
But also show the overlapping area as shown here
hist(rnorm(mean=10, n = 1000), col='blue') hist(rnorm(mean=11, n = 1000), col=rgb(1,0,0,0.5), add=T)
Similar question that doesn't quite address transparency:
How to create black and white transparent overlapping histograms using ggplot2?
I'd be fine with densities and use of other graphing packages (e.g. lattice, ggplot2, etc).
Edit: I'd like the plots to be filled and the intersecting area to be a different color (e.g. purple where red and blue intersect).
3 Answers
A solution using ggplot2 and geom_density.
library(ggplot2) library(tidyr) # create data set.seed(1234) df <- data.frame(x = rnorm(1000, 10), y = rnorm(1000, 11)) %>% gather(key, value) # use tidyr::gather to convert from wide to long format ggplot(df, aes(value, colour = key)) + geom_density(show.legend = F) + theme_minimal() + scale_color_manual(values = c(x = "red", y = "blue")) 
# use 'adjust' to adjust density estimation ggplot(df, aes(value, colour = key)) + geom_density(show.legend = F, adjust = .5) + theme_minimal() + scale_color_manual(values = c(x = "red", y = "blue"))
Histogram
Since alpha is no option, apart from using densities you could stack the histograms on top of each other, although I'd prefer densities, since they are easier to compare.
# using stacked histograms ggplot(df, aes(value, fill = key)) + geom_histogram(show.legend = F) + theme_minimal() + scale_fill_manual(values = c(x = "red", y = "blue")) #> `stat_bin()` using `bins = 30`. Pick better value with `binwidth`.
If you do not insist on the overlap, then you may consider plotting the bars of the histogram side-by-side using the "dodge" positioning option of ggplot. For example:
# generate data, some Normal and Gamma variates with the same mean & SD set.seed(137) rd <- data.frame( n=rnorm(1000, mean=6.0, sd=4.243), g=rgamma(1000, shape=2, scale=3) ) # convert the data frame to "tall" format tall.rd <- stack(rd) # make the plot ggplot(tall.rd) + geom_histogram( aes(values,..density..,colour=ind, fill=ind), bins=20,position="dodge" ) 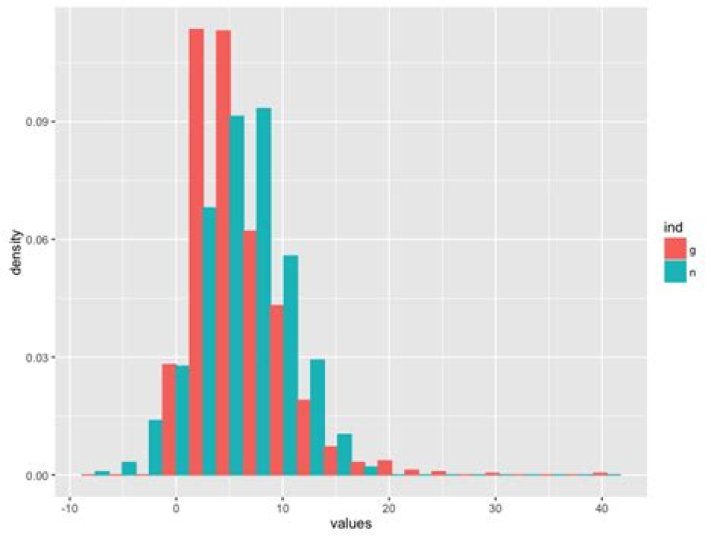
I came up with a kludge for this using the concept of layers. In essence I lay down the red without the alpha, add back the blue layer underneath, and then put the red back again with the alpha adjustment to keep the overlapping region at the contrast I want (i.e. it stays purple).
one <- rnorm(mean=10, n = 1000) two <- rnorm(mean=11, n = 1000) hist(one, col='blue', main='Bright colors, visible overlap') hist(two, col='red', add=T) hist(one, col='blue', add=T) hist(two, col=rgb(1,0,0,0.5), add=T)
Also works for ggplot:
qplot(one, fill=I('blue'))+ geom_histogram(aes(two), fill=I('red'))+ geom_histogram(aes(one), fill=I('blue'))+ geom_histogram(aes(two), fill=I('red'), alpha=I(0.5))