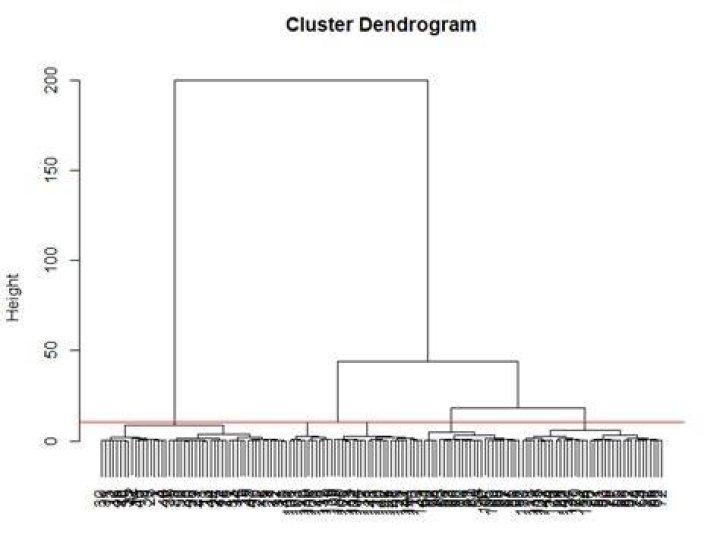
I am using hierarchical clustering to classify my data.
I would like to define the optimal number of clusters. To do so, the idea is to visualize a graph that the x-axis is the number of clusters, and the y-axis is the height of the tree in the dendrogram.
And to do so, I need to know the height of the tree when the number of clusters K is specified, for example if K=4, I need to know the height of tree after the command
cutree(hclust(dist(data), method = "ward.D"), k = 4) Can someone help please?
1 Answer
The heights are stored in the hclust object. Since you do not provide any data, I will illustrate with the built-in iris data.
HC = hclust(dist(iris[,1:4]), method="ward.D") sort(HC$height) <reduced output> [133] 1.8215623 1.8787489 1.9240172 1.9508686 2.5143038 2.7244855 [139] 2.9123706 3.1111893 3.2054610 3.9028695 4.9516315 6.1980126 [145] 9.0114060 10.7530460 18.2425079 44.1751473 199.6204659 The biggest value is the height of the first split. Second biggest is second split, etc. You can see that this gives the heights that you need by plotting.
plot(HC) abline(h=10.75,col="red") 
You can see that the fourth biggest height matches the height of the fourth split.