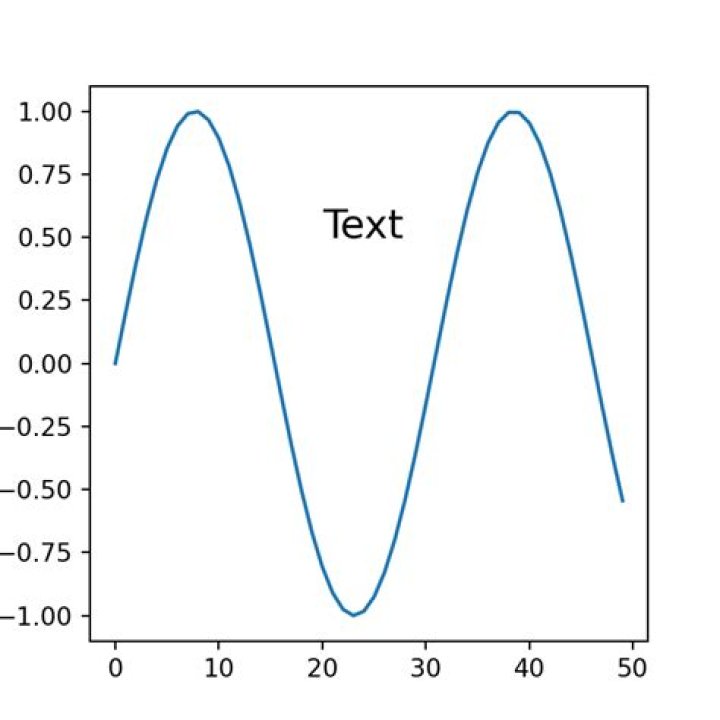
I need to annotate a pylab rectangle with few data lines - which are of different length. Searching through the matplotlib documentation, and Googling, I could not find a way to give different parts of an annotation different sizes.
The following snippet demonstrates the problem:
import pylab from matplotlib.patches import Rectangle pylab.rcParams['verbose.level'] = 'debug-annoying' def draw_rectangle(lower, upper, entry): ax = pylab.subplot(111) r = Rectangle( lower, upper[0]-lower[0], upper[1] - lower[1], edgecolor='k') ax.add_patch(r) textRank = str(entry['rank']) textTeamName = entry['teamName'] textSubmissionDate = entry['submissionDate'] text = textRank + "\n" + textTeamName + "\n" + textSubmissionDate ax.add_artist(r) rx, ry = r.get_xy() cx = rx + r.get_width()/2.0 cy = ry + r.get_height()/2.0 ax.annotate(text, (cx, cy), color='w', weight='bold', ha='center', va='center', size=14) if __name__ == '__main__': entry = {'rank': 22, 'submissionDate': '12/21/2012 4:58:45 AM', 'teamName': 'A very very very very very very very very very very long name'} lower = [0,0] upper = [1,1] draw_rectangle(lower, upper, entry) pylab.show() 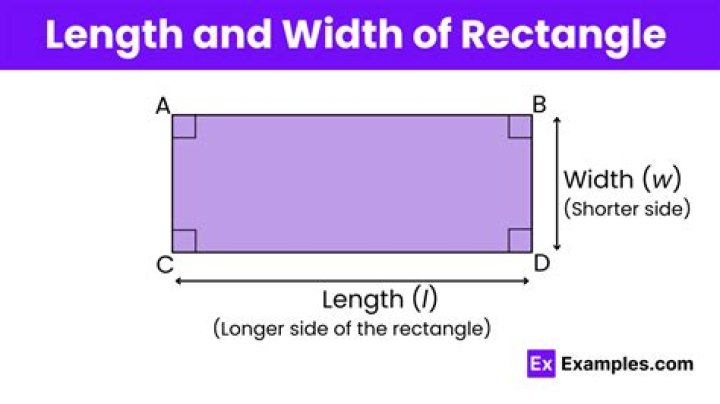 E.g., is there a way to have the annotation where the font size of 'teamName' is different than the font size of 'rank'?
Another problem is I could not find a way for the font size to correlate to the zooming:
I'm creating a treemap plot, namely, the pylab window is filled with different sized rectangles. If I want to create annotations for the different rectangles, the long data need to be of very small size (to stay within the respective rectangles' boundaries). However, I'd like the font size of the long data line to grow as I zoom in. 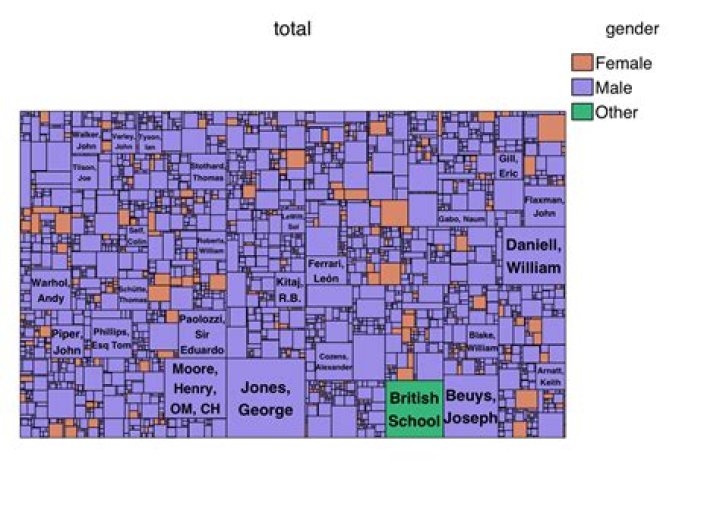
2 Answers
Make your plot first, then use ax.annotate, iterating over your x coordinates, y coordinates, labels and fontsizes.
import matplotlib.pyplot as plt X = [1,2,3,4,5] Y = [1,1,1,1,1] labels = 'ABCDE' sizes = [10, 15, 20, 25, 30] fig, ax = plt.subplots() ax.scatter(X, Y) for x, y, label, size in zip(X, Y, labels, sizes): ax.annotate(label, (x, y), fontsize=size) plt.show() 
I couldn't find a way to create an annotation with different fonts, so I'll create a helper function that will calculate the font weight to use on each line of the annotation, with the relevant (cx, cy),
and then call ax.annotate several times.