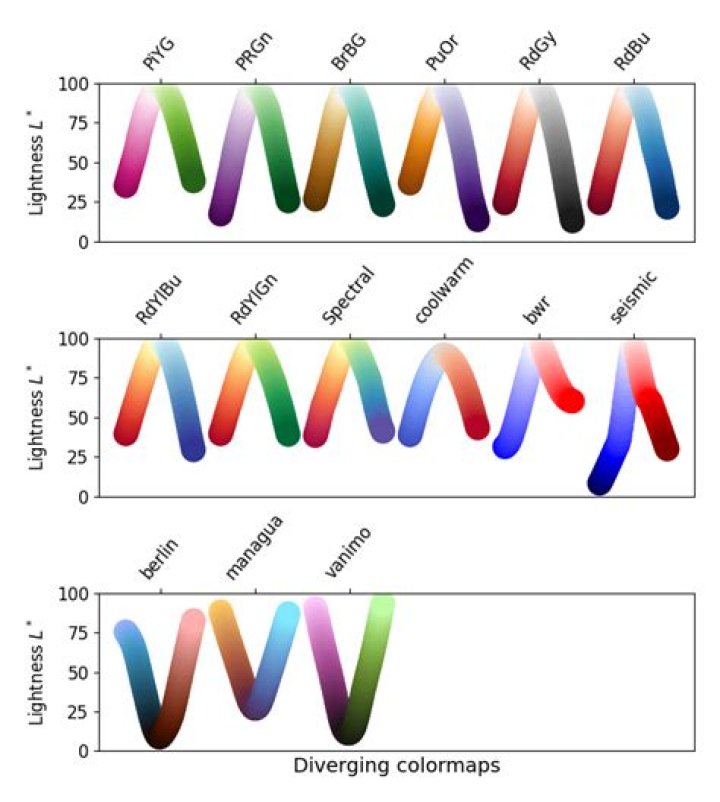

I am using imshow() in matplotlib like so:
import numpy as np import matplotlib.pyplot as plt mat = '''SOME MATRIX''' plt.imshow(mat, origin="lower", cmap='gray', interpolation='nearest') plt.show() How do I add a legend showing the numeric value for the different shades of gray. Sadly, my googling has not uncovered an answer :(
Thank you in advance for the help.
Vince
3 Answers
Simple, just plt.colorbar():
import numpy as np import matplotlib.pyplot as plt mat = np.random.random((10,10)) plt.imshow(mat, origin="lower", cmap='gray', interpolation='nearest') plt.colorbar() plt.show() There's a builtin colorbar() function in pyplot. Here's an example using subplots:
fig = plt.figure() ax = fig.add_subplot(1,1,1) plot = ax.pcolor(data) fig.colorbar(plot); As usual, I figure it out right after I ask it ;). For posterity, here's my stab at it:
m = np.zeros((1,20)) for i in range(20): m[0,i] = (i*5)/100.0 print m plt.imshow(m, cmap='gray', aspect=2) plt.yticks(np.arange(0)) plt.xticks(np.arange(0,25,5), [0,25,50,75,100]) plt.show() I'm sure there exists a more elegant solution.
Vince
1