I understand that:
atan2(vector.y, vector.x) = the angle between the vector and the X axis.
But I wanted to know how to get the angle between two vectors using atan2. So I came across this solution:
atan2(vector1.y - vector2.y, vector1.x - vector2.x) My question is very simple:
Will the two following formulas produce the same number?
atan2(vector1.y - vector2.y, vector1.x - vector2.x)atan2(vector2.y - vector1.y, vector2.x - vector1.x)
If not: How do I know what vector comes first in the subtractions?
310 Answers
atan2(vector1.y - vector2.y, vector1.x - vector2.x) is the angle between the difference vector (connecting vector2 and vector1) and the x-axis, which is problably not what you meant.
The (directed) angle from vector1 to vector2 can be computed as
angle = atan2(vector2.y, vector2.x) - atan2(vector1.y, vector1.x); and you may want to normalize it to the range [0, 2 π):
if (angle < 0) { angle += 2 * M_PI; } or to the range (-π, π]:
if (angle > M_PI) { angle -= 2 * M_PI; } else if (angle <= -M_PI) { angle += 2 * M_PI; } A robust way to do it is by finding the sine of the angle using the cross product, and the cosine of the angle using the dot product and combine the two with the Atan2() function.
In C# this is
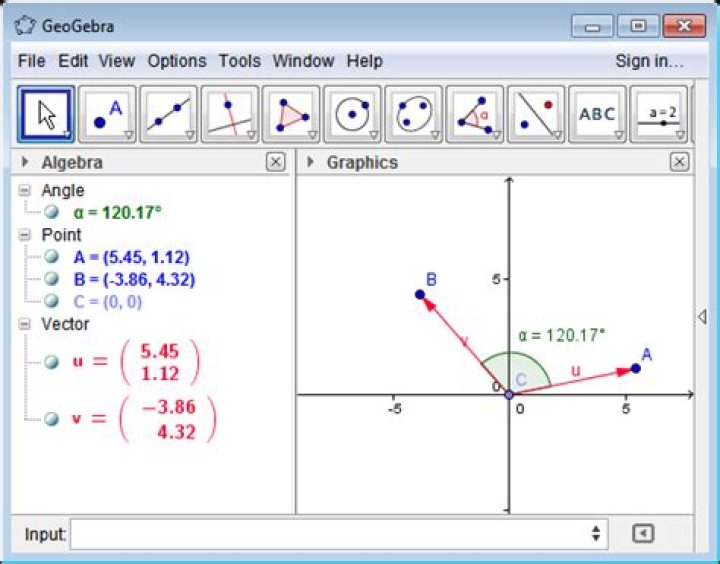
public struct Vector2 { public double X, Y; /// <summary> /// Returns the angle between two vectos /// </summary> public static double GetAngle(Vector2 A, Vector2 B) { // |A·B| = |A| |B| COS(θ) // |A×B| = |A| |B| SIN(θ) return Math.Atan2(Cross(A,B), Dot(A,B)); } public double Magnitude { get { return Math.Sqrt(Dot(this,this)); } } public static double Dot(Vector2 A, Vector2 B) { return A.X*B.X+A.Y*B.Y; } public static double Cross(Vector2 A, Vector2 B) { return A.X*B.Y-A.Y*B.X; } } class Program { static void Main(string[] args) { Vector2 A=new Vector2() { X=5.45, Y=1.12}; Vector2 B=new Vector2() { X=-3.86, Y=4.32 }; double angle=Vector2.GetAngle(A, B) * 180/Math.PI; // angle = 120.16850967865749 } } See test case above in GeoGebra.
I think a better formula was posted here:
angle = atan2(norm(cross(a,b)), dot(a,b)) So this formula works in 2 or 3 dimensions. For 2 dimensions this formula simplifies to the one stated above.
3Nobody pointed out that if you have a single vector, and want to find the angle of the vector from the X axis, you can take advantage of the fact that the argument to atan2() is actually the slope of the line, or (delta Y / delta X). So if you know the slope, you can do the following:
given:
A = angle of the vector/line you wish to determine (from the X axis).
m = signed slope of the vector/line.
then:
A = atan2(m, 1)
Very useful!
0If you care about accuracy for small angles, you want to use this:
angle = 2*atan2(|| ||b||a - ||a||b ||, || ||b||a + ||a||b ||)
Where "||" means absolute value, AKA "length of the vector". See
However, that has the downside that in two dimensions, it loses the sign of the angle.
As a complement to the answer of @martin-r one should note that it is possible to use the sum/difference formula for arcus tangens.
angle = atan2(vec2.y, vec2.x) - atan2(vec1.y, vec1.x); angle = -atan2(vec1.x * vec2.y - vec1.y * vec2.x, dot(vec1, vec2)) where dot = vec1.x * vec2.x + vec1.y * vec2.y - Caveat 1: make sure the angle remains within -pi ... +pi
- Caveat 2: beware when the vectors are getting very similar, you might get extinction in the first argument, leading to numerical inaccuracies
You don't have to use atan2 to calculate the angle between two vectors. If you just want the quickest way, you can use dot(v1, v2)=|v1|*|v2|*cos A to get
A = Math.acos( dot(v1, v2)/(v1.length()*v2.length()) ); angle(vector.b,vector.a)=pi/2*((1+sgn(xa))*(1-sgn(ya^2))-(1+sgn(xb))*(1-sgn(yb^2))) +pi/4*((2+sgn(xa))*sgn(ya)-(2+sgn(xb))*sgn(yb)) +sgn(xa*ya)*atan((abs(xa)-abs(ya))/(abs(xa)+abs(ya))) -sgn(xb*yb)*atan((abs(xb)-abs(yb))/(abs(xb)+abs(yb))) xb,yb and xa,ya are the coordinates of the two vectors
2The formula, angle(vector.b,vector.a), that I sent, give results
in the four quadrants and for any coordinates xa,ya and xb,yb.
For coordinates xa=ya=0 and or xb=yb=0 is undefined.
The angle can be bigger or smaller than pi, and can be positive
or negative.
Here a little program in Python that uses the angle between vectors to determine if a point is inside or outside a certain polygon
import sys import numpy as np import matplotlib.pyplot as plt import matplotlib.patches as patches from shapely.geometry import Point, Polygon from pprint import pprint # Plot variables x_min, x_max = -6, 12 y_min, y_max = -3, 8 tick_interval = 1 FIG_SIZE = (10, 10) DELTA_ERROR = 0.00001 IN_BOX_COLOR = 'yellow' OUT_BOX_COLOR = 'black' def angle_between(v1, v2): """ Returns the angle in radians between vectors 'v1' and 'v2' The sign of the angle is dependent on the order of v1 and v2 so acos(norm(dot(v1, v2))) does not work and atan2 has to be used, see: """ arg1 = np.cross(v1, v2) arg2 = np.dot(v1, v2) angle = np.arctan2(arg1, arg2) return angle def point_inside(point, border): """ Returns True if point is inside border polygon and False if not Arguments: :point: x, y in shapely.geometry.Point type :border: [x1 y1, x2 y2, ... , xn yn] in shapely.geomettry.Polygon type """ assert len(border.exterior.coords) > 2,\ 'number of points in the polygon must be > 2' point = np.array(point) side1 = np.array(border.exterior.coords[0]) - point sum_angles = 0 for border_point in border.exterior.coords[1:]: side2 = np.array(border_point) - point angle = angle_between(side1, side2) sum_angles += angle side1 = side2 # if wn is 1 then the point is inside wn = sum_angles / 2 / np.pi if abs(wn - 1) < DELTA_ERROR: return True else: return False class MainMap(): @classmethod def settings(cls, fig_size): # set the plot outline, including axes going through the origin cls.fig, cls.ax = plt.subplots(figsize=fig_size) cls.ax.set_xlim(-x_min, x_max) cls.ax.set_ylim(-y_min, y_max) cls.ax.set_aspect(1) tick_range_x = np.arange(round(x_min + (10*(x_max - x_min) % tick_interval)/10, 1), x_max + 0.1, step=tick_interval) tick_range_y = np.arange(round(y_min + (10*(y_max - y_min) % tick_interval)/10, 1), y_max + 0.1, step=tick_interval) cls.ax.set_xticks(tick_range_x) cls.ax.set_yticks(tick_range_y) cls.ax.tick_params(axis='both', which='major', labelsize=6) cls.ax.spines['left'].set_position('zero') cls.ax.spines['right'].set_color('none') cls.ax.spines['bottom'].set_position('zero') cls.ax.spines['top'].set_color('none') @classmethod def get_ax(cls): return cls.ax @staticmethod def plot(): plt.tight_layout() plt.show() class PlotPointandRectangle(MainMap): def __init__(self, start_point, rectangle_polygon, tolerance=0): self.current_object = None self.currently_dragging = False self.fig.canvas.mpl_connect('key_press_event', self.on_key) self.plot_types = ['o', 'o-'] self.plot_type = 1 self.rectangle = rectangle_polygon # define a point that can be moved around self.point = patches.Circle((start_point.x, start_point.y), 0.10, alpha=1) if point_inside(start_point, self.rectangle): _color = IN_BOX_COLOR else: _color = OUT_BOX_COLOR self.point.set_color(_color) self.ax.add_patch(self.point) self.point.set_picker(tolerance) cv_point = self.point.figure.canvas cv_point.mpl_connect('button_release_event', self.on_release) cv_point.mpl_connect('pick_event', self.on_pick) cv_point.mpl_connect('motion_notify_event', self.on_motion) self.plot_rectangle() def plot_rectangle(self): x = [point[0] for point in self.rectangle.exterior.coords] y = [point[1] for point in self.rectangle.exterior.coords] # y = self.rectangle.y self.rectangle_plot, = self.ax.plot(x, y, self.plot_types[self.plot_type], color='r', lw=0.4, markersize=2) def on_release(self, event): self.current_object = None self.currently_dragging = False def on_pick(self, event): self.currently_dragging = True self.current_object = event.artist def on_motion(self, event): if not self.currently_dragging: return if self.current_object == None: return point = Point(event.xdata, event.ydata) self.current_object.center = point.x, point.y if point_inside(point, self.rectangle): _color = IN_BOX_COLOR else: _color = OUT_BOX_COLOR self.current_object.set_color(_color) self.point.figure.canvas.draw() def remove_rectangle_from_plot(self): try: self.rectangle_plot.remove() except ValueError: pass def on_key(self, event): # with 'space' toggle between just points or points connected with # lines if event.key == ' ': self.plot_type = (self.plot_type + 1) % 2 self.remove_rectangle_from_plot() self.plot_rectangle() self.point.figure.canvas.draw() def main(start_point, rectangle): MainMap.settings(FIG_SIZE) plt_me = PlotPointandRectangle(start_point, rectangle) #pylint: disable=unused-variable MainMap.plot() if __name__ == "__main__": try: start_point = Point([float(val) for val in sys.argv[1].split()]) except IndexError: start_point= Point(0, 0) border_points = [(-2, -2), (1, 1), (3, -1), (3, 3.5), (4, 1), (5, 1), (4, 3.5), (5, 6), (3, 4), (3, 5), (-0.5, 1), (-3, 1), (-1, -0.5), ] border_points_polygon = Polygon(border_points) main(start_point, border_points_polygon)