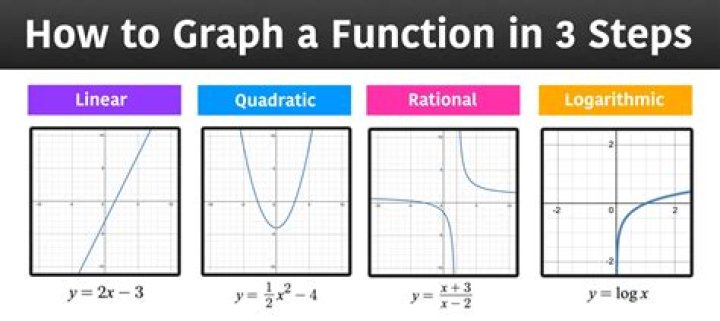
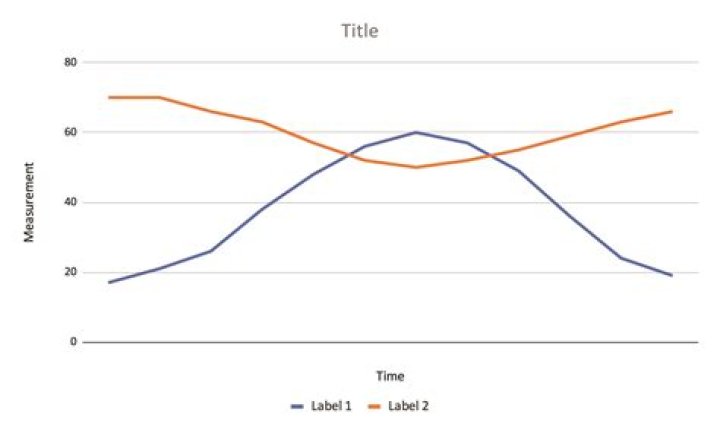
I'm trying to do a graph with two trendlines like in the following hand-drawn illustration, but this is the first time I've tried anything substantial in Excel and I can't figure out how to get anything other than a trendline that is just for all the data points in general. How can I do this?
1 Answer
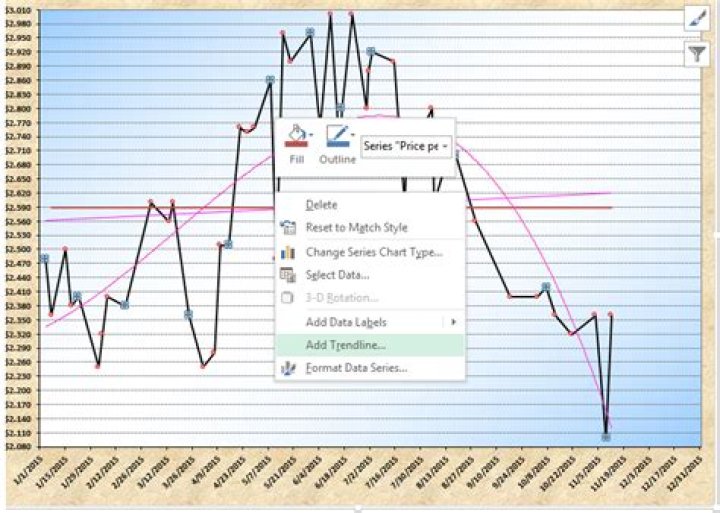
It is possible to addmore than one trend line to a graph. (Picture is of a spread sheet of my own creation.) There is a linear and polynomial trend line.
Right click on your data series (the actual line in the graph) then click on "Add Trendline". You should be able to add as many trendlines as you like.