The following are the inputs for my interpolation:
x = [-1.01, 5.66, 5.69, 13.77, 20.89] y = [0.28773, 1.036889, 1.043178, 1.595322, 1.543763] new_x = [0, 2, 4, 6, 8, 9, 10, 11, 12, 13, 14, 15, 16, 17, 18, 20] The results from matlab interp1 and scipy.interpolate interp1d are different.
The results are like this.
new_y_scipy=[0.401171, 0.625806, 0.850442, 1.062384, 1.186291, 1.248244, 1.310198, 1.372152, 1.434105, 1.496059, 1.545429, 1.55267, 1.559911, 1.567153, 1.574394, 1.588877,] new_y_matlab=[0.401171, 0.625806, 0.850442, 1.064362, 1.201031, 1.269366, 1.3377, 1.406035, 1.47437, 1.542704, 1.593656, 1.586415, 1.579174, 1.571932, 1.564691, 1.550208] Apparently matlab seems to get better result than scipy. What is the fundamental difference?
1 Answer
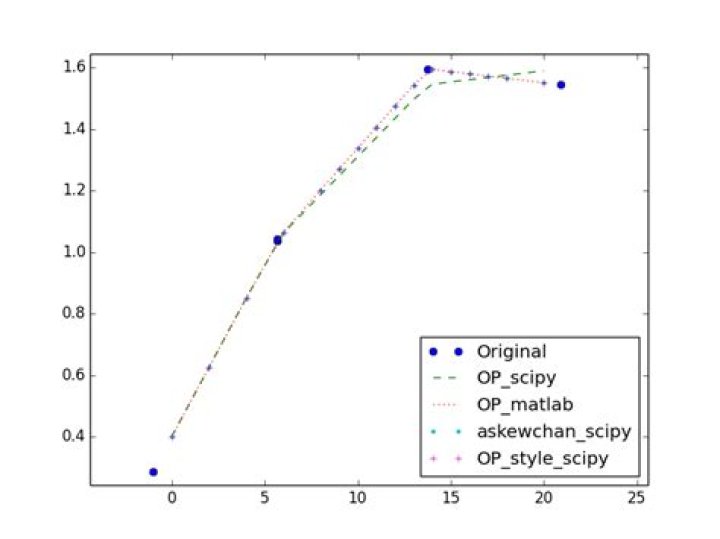
I think that your data from scipy might be messed up somehow, because I can't reproduce your problem. For me, the results from scipy match perfectly with your results from matlab. See below for a demonstration:
import numpy as np from scipy.interpolate import interp1d import matplotlib.pyplot as plt x = [-1.01, 5.66, 5.69, 13.77, 20.89] y = [0.28773, 1.036889, 1.043178, 1.595322, 1.543763] new_x = [0, 2, 4, 6, 8, 9, 10, 11, 12, 13, 14, 15, 16, 17, 18, 20] new_y_scipy=[0.401171, 0.625806, 0.850442, 1.062384, 1.186291, 1.248244, 1.310198, 1.372152, 1.434105, 1.496059, 1.545429, 1.55267, 1.559911, 1.567153, 1.574394, 1.588877,] new_y_matlab=[0.401171, 0.625806, 0.850442, 1.064362, 1.201031, 1.269366, 1.3377, 1.406035, 1.47437, 1.542704, 1.593656, 1.586415, 1.579174, 1.571932, 1.564691, 1.550208] askewchan = interp1d(x,y)(new_x) # 'linear' has no effect since it's the default, but I'll plot it too: set_interp = interp1d(x, y, kind='linear') new_y = set_interp(new_x) plt.plot(x, y, 'o', new_x, new_y_scipy, '--', new_x, new_y_matlab, ':', new_x, askewchan, '.', new_x, new_y, '+') plt.legend(('Original','OP_scipy', 'OP_matlab', 'askewchan_scipy', 'OP style scipy'), loc='lower right') np.allclose(new_y_matlab, interp1d(x,y)(new_x)) #True