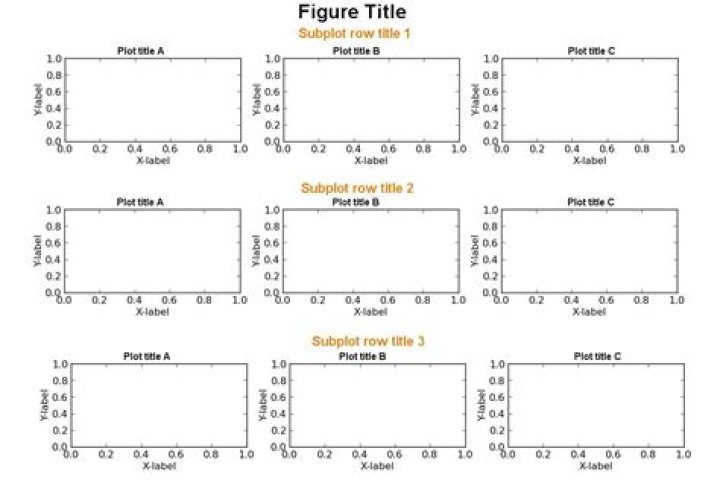
In matplotlib, Is it possible to set a a separate title for each row of subplots in addition to the title set for the entire figure and the title set for each individual plot? This would correspond to the orange text in the figure below. 
If not, how would you get around this problem? Create a separate column of empty subplots to the left and fill them with the orange text?
I am aware that it is possible to manually position each single title using text() or annotate(), but that usually requires a lot of tweaking and I have many subplots. Is there a smoother solution?
4 Answers
New in matplotlib 3.4.0
Row titles can now be implemented as subfigure suptitles:
The new subfigure feature allows creating virtual figures within figures with localized artists (e.g., colorbars and suptitles) that only pertain to each subfigure.
See how to plot subfigures for further details.
How to reproduce OP's reference figure:
Either
Figure.subfigures(most straightforward)Create 3x1
fig.subfigureswhere eachsubfiggets its own 1x3subfig.subplotsandsubfig.suptitle:fig = plt.figure(constrained_layout=True) fig.suptitle('Figure title') # create 3x1 subfigs subfigs = fig.subfigures(nrows=3, ncols=1) for row, subfig in enumerate(subfigs): subfig.suptitle(f'Subfigure title {row}') # create 1x3 subplots per subfig axs = subfig.subplots(nrows=1, ncols=3) for col, ax in enumerate(axs): ax.plot() ax.set_title(f'Plot title {col}')Or
Figure.add_subfigure(onto existingsubplots)If you already have 3x1
plt.subplots, thenadd_subfigureinto the underlyinggridspec. Again eachsubfigwill get its own 1x3subfig.subplotsandsubfig.suptitle:# create 3x1 subplots fig, axs = plt.subplots(nrows=3, ncols=1, constrained_layout=True) fig.suptitle('Figure title') # clear subplots for ax in axs: ax.remove() # add subfigure per subplot gridspec = axs[0].get_subplotspec().get_gridspec() subfigs = [fig.add_subfigure(gs) for gs in gridspec] for row, subfig in enumerate(subfigs): subfig.suptitle(f'Subfigure title {row}') # create 1x3 subplots per subfig axs = subfig.subplots(nrows=1, ncols=3) for col, ax in enumerate(axs): ax.plot() ax.set_title(f'Plot title {col}')
Output of either example (after some styling):

An idea is to create three "big subplots", to give each of them a title, and make them invisible. On the top of that you can create your matrix of smaller subplots.
This solution is entirely based on this post, except that more attention has been paid to actually removing the background subplot.
import matplotlib.pyplot as plt fig, big_axes = plt.subplots( figsize=(15.0, 15.0) , nrows=3, ncols=1, sharey=True) for row, big_ax in enumerate(big_axes, start=1): big_ax.set_title("Subplot row %s \n" % row, fontsize=16) # Turn off axis lines and ticks of the big subplot # obs alpha is 0 in RGBA string! big_ax.tick_params(labelcolor=(1.,1.,1., 0.0), top='off', bottom='off', left='off', right='off') # removes the white frame big_ax._frameon = False for i in range(1,10): ax = fig.add_subplot(3,3,i) ax.set_title('Plot title ' + str(i)) fig.set_facecolor('w') plt.tight_layout() plt.show() Another easy cheat is to give the title of the middle column as subplot row XX\n\nPlot title No.YY
It is better to firstly plot your real subplots and then plot empty subplots above them, thus you will have a more precise title align. And to do it precisely we need plt.GridSpec() (link).
It is best seen in columns subtitles:
# modified code of @snake_chrmer fig, big_axes = plt.subplots(figsize=(9, 3) , nrows=1, ncols=3, sharey=True) for title, big_ax in zip(['First', 'Second', 'Third'], big_axes): big_ax.set_title(f'{title}\n', fontweight='semibold') big_ax.set_frame_on(False) big_ax.axis('off') for i in range(1, 7): ax = fig.add_subplot(1,6,i) ax.set_title('Plot title ' + str(i)) fig.set_facecolor('w') plt.tight_layout() plt.show()
# my solition import matplotlib.pyplot as plt from matplotlib.gridspec import SubplotSpec def create_subtitle(fig: plt.Figure, grid: SubplotSpec, title: str): "Sign sets of subplots with title" row = fig.add_subplot(grid) # the '\n' is important row.set_title(f'{title}\n', fontweight='semibold') # hide subplot row.set_frame_on(False) row.axis('off') rows = 1 cols = 6 fig, axs = plt.subplots(rows, cols, figsize=(9, 3)) for i, ax in enumerate(axs.flatten()): ax.set_title(f'Plot title {i}') grid = plt.GridSpec(rows, cols) create_subtitle(fig, grid[0, 0:2], 'First') create_subtitle(fig, grid[0, 2:4], 'Second') create_subtitle(fig, grid[0, 4:6], 'Third') fig.tight_layout() fig.set_facecolor('w')
# original problem rows = 3 cols = 3 fig, axs = plt.subplots(rows, cols, figsize=(9, 9)) for i, ax in enumerate(axs.flatten()): ax.set_title(f'Plot title {i}') grid = plt.GridSpec(rows, cols) create_subtitle(fig, grid[0, ::], 'First') create_subtitle(fig, grid[1, ::], 'Second') create_subtitle(fig, grid[2, ::], 'Third') fig.tight_layout() fig.set_facecolor('w')
UPD
It is more logical and comprehensible to create subgrid for a set of subplots just to title them. The subgrig gives a wast space for modifications:
import matplotlib.pyplot as plt import matplotlib.gridspec as gridspec rows = 1 cols = 3 fig = plt.figure(figsize=(9, 3)) # grid for pairs of subplots grid = plt.GridSpec(rows, cols) for i in range(rows * cols): # create fake subplot just to title pair of subplots fake = fig.add_subplot(grid[i]) # '\n' is important fake.set_title(f'Fake #{i}\n', fontweight='semibold', size=14) fake.set_axis_off() # create subgrid for two subplots without space between them # < gs = gridspec.GridSpecFromSubplotSpec(1, 2, subplot_spec=grid[i], wspace=0) # real subplot #1 ax = fig.add_subplot(gs[0]) ax.set_title(f'Real {i}1') # hide ticks and labels ax.tick_params(left=False, labelleft=False, labelbottom=False, bottom=False) # real subplot #2 ax = fig.add_subplot(gs[1], sharey=ax) ax.set_title(f'Real {i}2') # hide ticks and labels ax.tick_params(left=False, labelleft=False, labelbottom=False, bottom=False) fig.patch.set_facecolor('white') fig.suptitle('SUPERTITLE', fontweight='bold', size=16) fig.tight_layout()
Original problem:
rows = 3 cols = 1 fig = plt.figure(figsize=(9, 9)) # grid for pairs of subplots grid = plt.GridSpec(rows, cols) for i in range(rows * cols): # create fake subplot just to title set of subplots fake = fig.add_subplot(grid[i]) # '\n' is important fake.set_title(f'Fake #{i}\n', fontweight='semibold', size=14) fake.set_axis_off() # create subgrid for two subplots without space between them # < gs = gridspec.GridSpecFromSubplotSpec(1, 3, subplot_spec=grid[i]) # real subplot #1 ax = fig.add_subplot(gs[0]) ax.set_title(f'Real {i}1') # real subplot #2 ax = fig.add_subplot(gs[1], sharey=ax) ax.set_title(f'Real {i}2') # real subplot #3 ax = fig.add_subplot(gs[2], sharey=ax) ax.set_title(f'Real {i}3') fig.patch.set_facecolor('white') fig.suptitle('SUPERTITLE', fontweight='bold', size=16) fig.tight_layout()