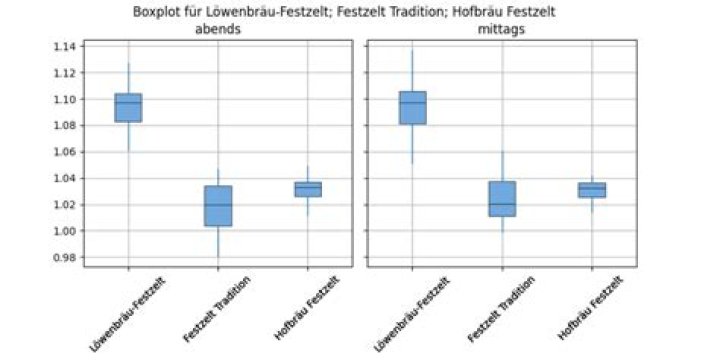

I have a two boxplotes
a1=a[['kCH4_sync','week_days']] a1.boxplot(by = 'week_days', meanline=True, showmeans=True, showcaps=True, showbox=True, showfliers=False) a2=a[['CH4_sync','week_days']] a2.boxplot(by = 'week_days', meanline=True, showmeans=True, showcaps=True, showbox=True, showfliers=False) But I want to place them in one graph to compare them. Have you any advice to solve this problem? Thanks!
3 Answers
To plot multiple boxplots on one matplotlib graph you can pass a list of data arrays to boxplot, as in:
import numpy as np import matplotlib.pyplot as plt x1 = 10*np.random.random(100) x2 = 10*np.random.exponential(0.5, 100) x3 = 10*np.random.normal(0, 0.4, 100) plt.boxplot ([x1, x2, x3]) The only thing I am not sure of is if you want each boxplot to have a different color etc. Generally it won't plot in different colour
Use return_type='axes' to get a1.boxplot to return a matplotlib Axes object. Then pass that axes to the second call to boxplot using ax=ax. This will cause both boxplots to be drawn on the same axes.
a1=a[['kCH4_sync','week_days']] ax = a1.boxplot(by='week_days', meanline=True, showmeans=True, showcaps=True, showbox=True, showfliers=False, return_type='axes') a2 = a[['CH4_sync','week_days']] a2.boxplot(by='week_days', meanline=True, showmeans=True, showcaps=True, showbox=True, showfliers=False, ax=ax) It easy using pandas:
import numpy as np import matplotlib.pyplot as plt import pandas as pd col1 = np.random.random(10) col2 = np.random.random(10) DF = pd.DataFrame({'col1': col1, 'col2': col2}) ax = DF[['col1', 'col2']].plot(kind='box', title='boxplot', showmeans=True) plt.show() Note that when using Pandas for this, the last command (ax = DF[[...) opens a new figure. I'm still looking for a way to combine this with existing subplots.