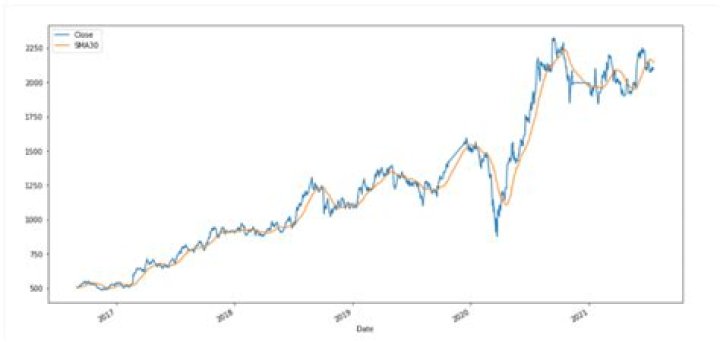

I would like to add a moving average calculation to my exchange time series.
Original data from Quandl
Exchange = Quandl.get("BUNDESBANK/BBEX3_D_SEK_USD_CA_AC_000", authtoken="xxxxxxx") # Value # Date # 1989-01-02 6.10500 # 1989-01-03 6.07500 # 1989-01-04 6.10750 # 1989-01-05 6.15250 # 1989-01-09 6.25500 # 1989-01-10 6.24250 # 1989-01-11 6.26250 # 1989-01-12 6.23250 # 1989-01-13 6.27750 # 1989-01-16 6.31250 # Calculating Moving Avarage MovingAverage = pd.rolling_mean(Exchange,5) # Value # Date # 1989-01-02 NaN # 1989-01-03 NaN # 1989-01-04 NaN # 1989-01-05 NaN # 1989-01-09 6.13900 # 1989-01-10 6.16650 # 1989-01-11 6.20400 # 1989-01-12 6.22900 # 1989-01-13 6.25400 # 1989-01-16 6.26550 I would like to add the calculated Moving Average as a new column to the right after Value using the same index (Date). Preferably I would also like to rename the calculated moving average to MA.
4 Answers
The rolling mean returns a Series you only have to add it as a new column of your DataFrame (MA) as described below.
For information, the rolling_mean function has been deprecated in pandas newer versions. I have used the new method in my example, see below a quote from the pandas documentation.
Warning Prior to version 0.18.0,
pd.rolling_*,pd.expanding_*, andpd.ewm*were module level functions and are now deprecated. These are replaced by using theRolling,ExpandingandEWM.objects and a corresponding method call.
df['MA'] = df.rolling(window=5).mean() print(df) # Value MA # Date # 1989-01-02 6.11 NaN # 1989-01-03 6.08 NaN # 1989-01-04 6.11 NaN # 1989-01-05 6.15 NaN # 1989-01-09 6.25 6.14 # 1989-01-10 6.24 6.17 # 1989-01-11 6.26 6.20 # 1989-01-12 6.23 6.23 # 1989-01-13 6.28 6.25 # 1989-01-16 6.31 6.27 A moving average can also be calculated and visualized directly in a line chart by using the following code:
Example using stock price data:
import pandas_datareader.data as web import matplotlib.pyplot as plt import datetime plt.style.use('ggplot') # Input variables start = datetime.datetime(2016, 1, 01) end = datetime.datetime(2018, 3, 29) stock = 'WFC' # Extrating data df = web.DataReader(stock,'morningstar', start, end) df = df['Close'] print df plt.plot(df['WFC'],label= 'Close') plt.plot(df['WFC'].rolling(9).mean(),label= 'MA 9 days') plt.plot(df['WFC'].rolling(21).mean(),label= 'MA 21 days') plt.legend(loc='best') plt.title('Wells Fargo\nClose and Moving Averages') plt.show() In case you are calculating more than one moving average:
for i in range(2,10): df['MA{}'.format(i)] = df.rolling(window=i).mean() Then you can do an aggregate average of all the MA
df[[f for f in list(df) if "MA" in f]].mean(axis=1) To get the moving average in pandas we can use cum_sum and then divide by count.
Here is the working example:
import pandas as pd import numpy as np df = pd.DataFrame({'id': range(5), 'value': range(100,600,100)}) # some other similar statistics df['cum_sum'] = df['value'].cumsum() df['count'] = range(1,len(df['value'])+1) df['mov_avg'] = df['cum_sum'] / df['count'] # other statistics df['rolling_mean2'] = df['value'].rolling(window=2).mean() print(df) output
id value cum_sum count mov_avg rolling_mean2 0 0 100 100 1 100.0 NaN 1 1 200 300 2 150.0 150.0 2 2 300 600 3 200.0 250.0 3 3 400 1000 4 250.0 350.0 4 4 500 1500 5 300.0 450.0