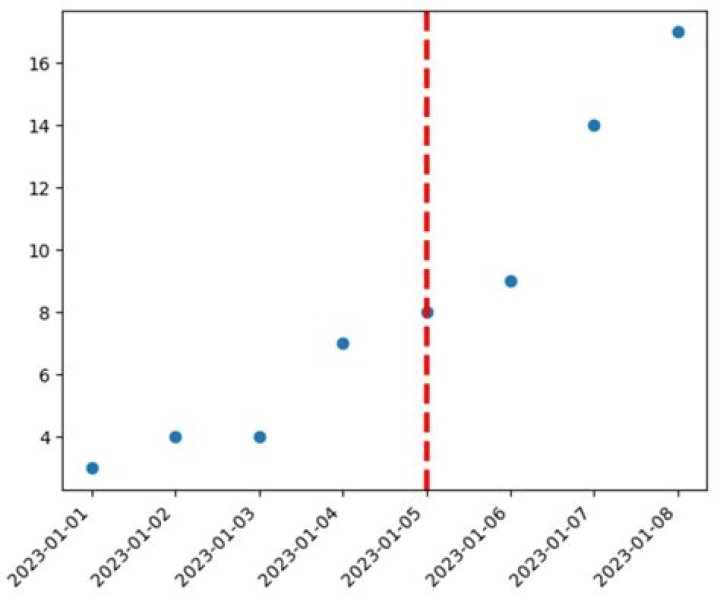
My data is stored as a pandas dataframe. I have created a chart of date (object format) vs. percentile (int64 format) using the plot_date() function in matplotlib and would like to add some vertical lines at pre-specified dates.
I have managed to add point markers at the pre-specified dates, but can't seem to find a way to make them into vertical lines.
I've found various answers on SO/SE about how to add vertical lines to a plot(), but am having trouble converting my data to a format that can be used by plot(), hence why I have used plot_date().
Sample data:
date percentile 2012-05-30 3 2014-11-25 60 2012-06-15 38 2013-07-18 16 My code to plot the chart is as below:
x_data = data["date"] y_data = data["percentile"] plt.figure() plt.plot() #create a scatter chart of dates vs. percentile plt.plot_date(x = x_data, y = y_data) #now add a marker at prespecified dates - ideally this would be a vertical line plt.plot_date(x = '2012-09-21', y = 0) plt.savefig("percentile_plot.png") plt.close() Unfortunately I can't provide an image of the current output as the code is on a terminal with no web access.
Any help is greatly appreciated - also in terms of how I've asked the question as I am quite new to SO / SE.
Thank you.
2 Answers
In MatPlotLib 1.4.3 this works:
import datetime as dt plt.axvline(dt.datetime(2012, 9, 21)) Passing a string-style date (2012-09-21) doesn't work because MPL doesn't know this is a date. Whatever code you are using to load your file is probably implicitly creating datetime objects out of your strings, which is why the plot call works.
Also, in MPL 1.4.3, I did not need to call plt.plot_date(data['date'], ...), simply calling plt.plot(data['date'], ...) worked for me as long as the data['date'] column is a column of datetime objects.
Good luck.
2Use pandas. Here is an example, also converting to timestamps just in case:
df = pd.DataFrame({ 'date':[ '2012-05-30', '2014-11-25', '2012-06-15', '2013-07-18', ], 'percentile':[3,60,38,16] }) df['date'] = df['date'].apply(pd.Timestamp) df=df.set_index('date') df.plot(marker='o') plt.axvline(pd.Timestamp('2013-09-21'),color='r') Here is the output: