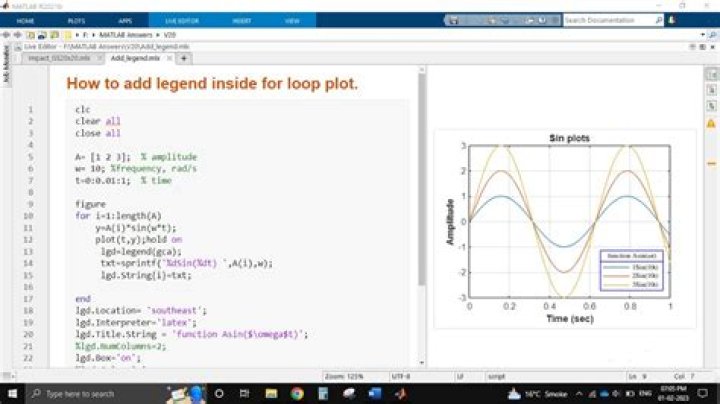
I have a for loop that looks somewhat like these:
RowToPlot =2; Num=2; SwatchToPlots=[2 3]; DataToGraph=rand(168,97); [RowsData,ColsData]=size(DataToGraph); x=1:RowsData; figure for idx=1:Num SwatchToPlot=SwatchToPlots(1,idx); if RowToPlot==1 if SwatchToPlot==1 plot(x,DataToGraph(:,22:25));hold on; legend('ex1', 'ex2', 'ex3', 'ex4'); elseif SwatchToPlot==2 plot(x,DataToGraph(:,46:49));hold on; legend('ex1', 'ex2', 'ex3', 'ex4'); elseif SwatchToPlot==3 plot(x,DataToGraph(:,70:73));hold on; legend('ex1', 'ex2', 'ex3', 'ex4'); elseif SwatchToPlot==4 plot(x,DataToGraph(:,94:97));hold on; legend('ex1', 'ex2', 'ex3', 'ex4'); end elseif RowToPlot==2 if SwatchToPlot==1 plot(x,DataToGraph(:,18:21));hold on; legend('ex1', 'ex2', 'ex3', 'ex4'); elseif SwatchToPlot==2 plot(x,DataToGraph(:,42:45));hold on; legend('ex1', 'ex2', 'ex3', 'ex4'); elseif SwatchToPlot==3 plot(x,DataToGraph(:,66:69));hold on; legend('ex1', 'ex2', 'ex3', 'ex4'); elseif SwatchToPlot==4 plot(x,DataToGraph(:,90:93));hold on; legend('ex1', 'ex2', 'ex3', 'ex4'); end end end Each plot line plots 4 lines in the y axis, and depending on the value in Num, the for loop could repeat and more lines could be plotted. If the for loop happens only one time, then I can easily add a legend using the legend() function. However, if the for loop happens more than once, the new legend does not append to the existing legend. How can I append the legend to the already existing legend, instead of just replacing it?
*Note: I've read similar questions but can't still make it work given that I'm plotting four y lines using a single plot() function.
11 Answer
It is best to always provide a Minimum Reproducible Example. Since that was not provided, I wrote a dummy script underlying the usage of legend command within loops.
close all; clc; t = 0:0.01:10; % time vec w = 1; % fixed frequency in rad arrayLimiter = length(t); % create some sine signals with phase delay for demo purposes signal1 = zeros(arrayLimiter, 1); signal2 = zeros(arrayLimiter, 1); signal3 = zeros(arrayLimiter, 1); for i = 1:arrayLimiter signal1(i) = sin(2*pi*w*t(i) + 0); signal2(i) = sin(2*pi*w*t(i) + 30); signal3(i) = sin(2*pi*w*t(i) + 60); end figure; hold on; grid on; set(gcf, 'color', 'w'), ylim([-2 2]), for i = 1:3 plot(t, signalArr(:, i), 'DisplayName', ['Singal ', num2str(i)]), end legend show, Which gives the following output:  You can programmatically add as many legend entries along with signals, using the "DisplayName" functionality of the plot function. Let me know if anything is unclear.