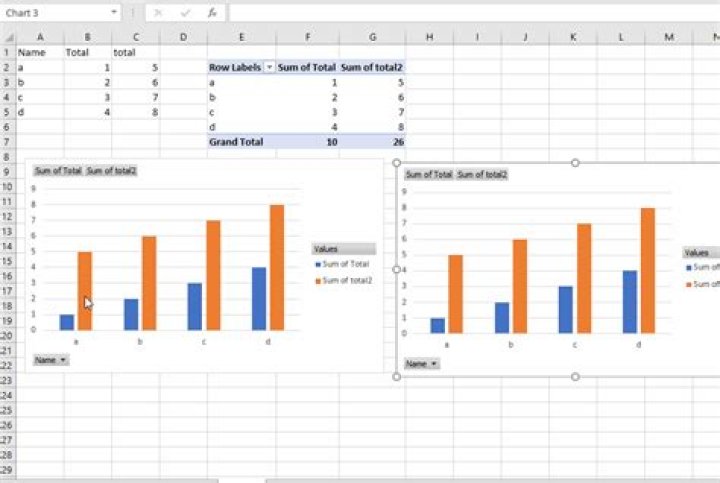
I have a pivot table with fields comprising of sums and average. I want to create two separate charts (one for the sum, and other for the averages).
Every time I try selecting a pivot chart, it shows both the fields.
What would be the most perfect way to use these pivot charts separately in one pivot table sheet in excel?
1 Answer
Because both charts are linked to the same PivotTable, if you change the field setting this means you change the PivotTable setting.
If you want to work with 2 Pivot Chart with the same PivotTable, try to fill No fill color for each Chart Series:
Copy the Pivot Chart and Paste it:

No fill Color for each Chart: