I am using the below code. But I don't seem to find the error. My JSON file looks like the below link. I took this code from the D3.js website and just changes the data statement.
Can anyone please guide me, where am I going wrong in this? Would appreciate the help!!!
var data = [ ["Photofeed", 990], ["Geba", 962], ["Zoomcast", 955], ["Wikivu", 955], ["Oyoloo", 953], ["Vipe", 934], ["Rhynyx", 930], ]; // set the dimensions and margins of the graph var margin = { top: 10, right: 30, bottom: 30, left: 40 }, width = 460 - margin.left - margin.right, height = 400 - margin.top - margin.bottom; // append the svg object to the body of the page var svg = d3.select("#my_dataviz") .append("svg") .attr("width", width + margin.left + margin.right) .attr("height", height + margin.top + margin.bottom) .append("g") .attr("transform", "translate(" + margin.left + "," + margin.top + ")"); // X axis: scale and draw: var x = d3.scaleLinear() .domain([0, 1000]) // can use this instead of 1000 to have the max of data: d3.max(data, function(d) { return +d.price }) .range([0, width]); svg.append("g") .attr("transform", "translate(0," + height + ")") .call(d3.axisBottom(x)); // set the parameters for the histogram var histogram = d3.histogram() .value(function(d) { return d.price; }) // I need to give the vector of value .domain(x.domain()) // then the domain of the graphic .thresholds(x.ticks(70)); // then the numbers of bins // And apply this function to data to get the bins var bins = histogram(data); // Y axis: scale and draw: var y = d3.scaleLinear() .range([height, 0]); y.domain([0, d3.max(bins, function(d) { return d.length; })]); // d3.hist has to be called before the Y axis obviously svg.append("g") .call(d3.axisLeft(y)); // append the bar rectangles to the svg element svg.selectAll("rect") .data(bins) .enter() .append("rect") .attr("x", 1) .attr("transform", function(d) { return "translate(" + x(d.x0) + "," + y(d.length) + ")"; }) .attr("width", function(d) { return x(d.x1) - x(d.x0) - 1; }) .attr("height", function(d) { return height - y(d.length); }) .style("fill", "#69b3a2")<script src=""></script> <div></div>1 Answer
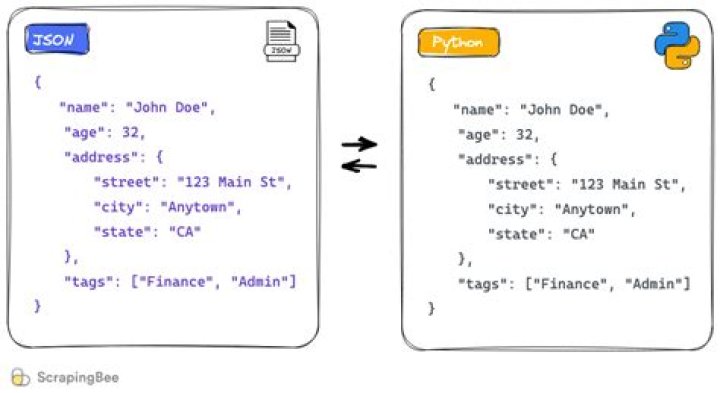
Your data structure is entirely different from theirs. You have an array of arrays, they have an array of objects.
They mention d.price somewhere in the code, replacing that by d[1] to get the second value from each array fixes it.
var data = [ ["Photofeed", 990], ["Geba", 962], ["Zoomcast", 955], ["Wikivu", 955], ["Oyoloo", 953], ["Vipe", 934], ["Rhynyx", 930], ]; // set the dimensions and margins of the graph var margin = { top: 10, right: 30, bottom: 30, left: 40 }, width = 460 - margin.left - margin.right, height = 400 - margin.top - margin.bottom; // append the svg object to the body of the page var svg = d3.select("#my_dataviz") .append("svg") .attr("width", width + margin.left + margin.right) .attr("height", height + margin.top + margin.bottom) .append("g") .attr("transform", "translate(" + margin.left + "," + margin.top + ")"); // X axis: scale and draw: var x = d3.scaleLinear() .domain([0, 1000]) // can use this instead of 1000 to have the max of data: d3.max(data, function(d) { return +d.price }) .range([0, width]); svg.append("g") .attr("transform", "translate(0," + height + ")") .call(d3.axisBottom(x)); // set the parameters for the histogram var histogram = d3.histogram() .value(function(d) { return d[1]; // <-- HERE it used to say d.price }) // I need to give the vector of value .domain(x.domain()) // then the domain of the graphic .thresholds(x.ticks(70)); // then the numbers of bins // And apply this function to data to get the bins var bins = histogram(data); // Y axis: scale and draw: var y = d3.scaleLinear() .range([height, 0]); y.domain([0, d3.max(bins, function(d) { return d.length; })]); // d3.hist has to be called before the Y axis obviously svg.append("g") .call(d3.axisLeft(y)); // append the bar rectangles to the svg element svg.selectAll("rect") .data(bins) .enter() .append("rect") .attr("x", 1) .attr("transform", function(d) { return "translate(" + x(d.x0) + "," + y(d.length) + ")"; }) .attr("width", function(d) { return x(d.x1) - x(d.x0) - 1; }) .attr("height", function(d) { return height - y(d.length); }) .style("fill", "#69b3a2")<script src=""></script> <div></div>