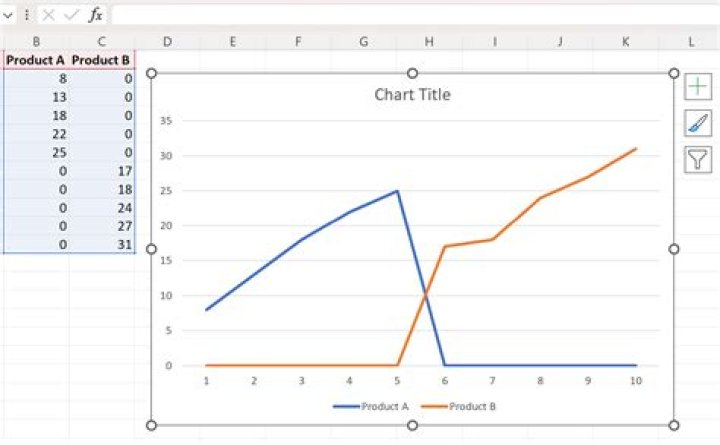
I have built a template in Excel that organizes data and shows a graph. The graph plots two fields, Var1 and Var2, on the vertical against year along the horizon. Both Var1 and Var2 are pulled from cells that are formulae.
I have found that I cannot tell the graph to ignore certain years from one variable and not from another. I have also found that the graph of either variable will show show values of zero. I would like for it to not. The only way I have found around this is to go to the cells from which the graph pulls and delete the formulae therein. This is a tedious process as we use this template for many instances. Is there a way to tell Excel to ignore cells that have a zero value even if it is the output of a function?
Thanks.
22 Answers
There are various methods for avoiding the zeroes, none of them are perfect. Below are a couple of such methods.
Filtering the data set
- Select the data range.
- On the Data tab, click Filter in the Sort & Filter group, to add a filter to all of the columns.
- Click the drop-down arrow on the column's first row and uncheck
0. - Click OK to filter the column, which will filter the entire row. Be sure to remove the filter when you're done.
Replace 0s with NA()
- Select the data set
- Click Find & Select in the Editing group on the Home tab and choose Replace, or type Ctrl+H.
- Enter
0in Find what. - Enter
=NA()in Replace - Click Options to display additional settings and check Match entire cell contents.
- Click Replace All.
- Click Close and OK.
For more information see the article How to suppress 0 values in an Excel chart.
With updated Excel, I believe you could do this via "Select Data" of your excel chart, then follow the screenshot