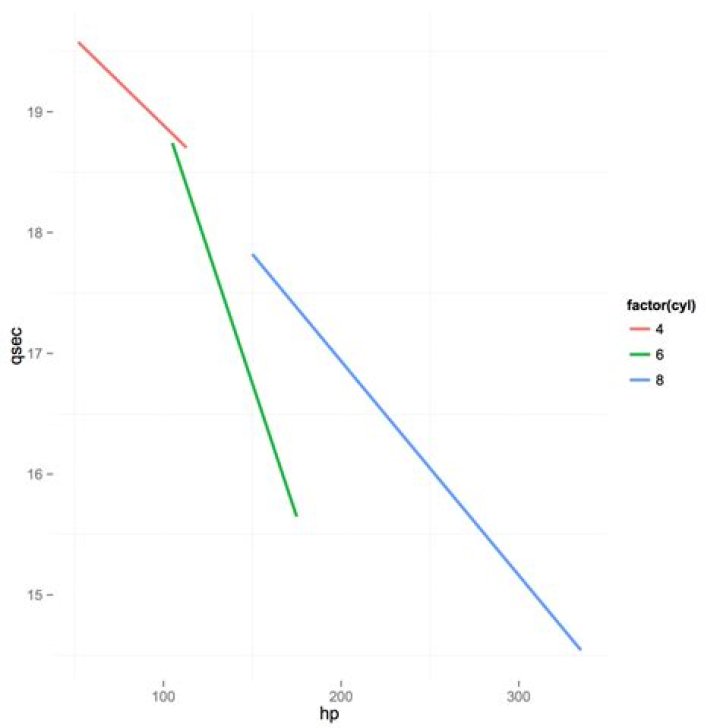
I have two plots. One with smoothed lines:
library(splines) library(ggplot2) ggplot(mtcars, aes(hp, qsec)) + stat_smooth(aes(group = cyl, colour = factor(cyl)), method = "glm", formula = y ~ ns(x, 1), level = 1e-9, size = I(1)) + theme(panel.background=element_rect(fill="transparent",colour=NA), plot.background=element_rect(fill="transparent",colour=NA), legend.key = element_rect(fill = "transparent", colour = "transparent")) and one without:
ggplot(mtcars, aes(hp, qsec)) + geom_point(aes(group = cyl, colour = factor(cyl))) + theme(panel.background=element_rect(fill="transparent",colour=NA), plot.background=element_rect(fill="transparent",colour=NA), legend.key = element_rect(fill = "transparent", colour = "transparent")) How can I get a white or transparent legend background in the first plot? And why do the same theme-commands do the job in the second plot?
1 Answer
It seems like the grey background is coming from stat_smooth(), as explained here. Adding se=FALSE, which deactivates the confidence intervals, seems to fix it:
ggplot(mtcars, aes(hp, qsec)) + stat_smooth(aes(group = cyl, colour = factor(cyl)), method = "glm", formula = y ~ ns(x, 1), level = 1e-9, size = I(1), se = FALSE) + theme(panel.background=element_rect(fill="transparent",colour=NA), plot.background=element_rect(fill="transparent",colour=NA), legend.key = element_rect(fill = "transparent", colour = "transparent"))