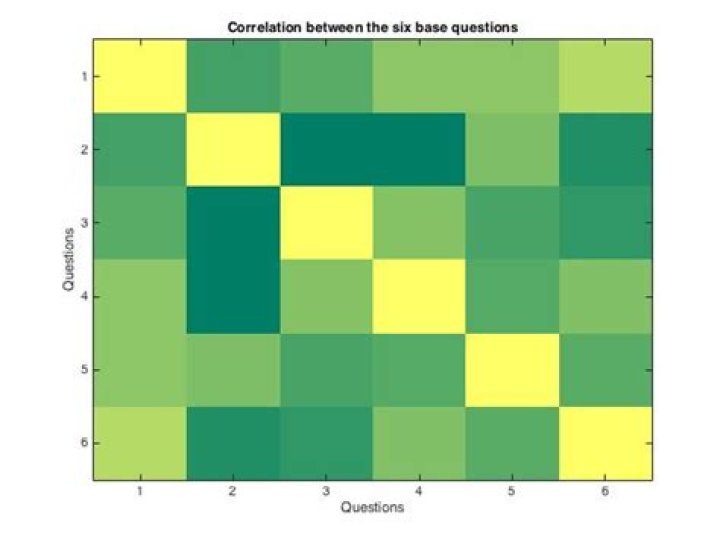
I'm using MATLABS function imagesc to plot a 6x6 matrix of doubles. This is the plot I get:
What I want to do is change the values on the x- and y-axis to values that I choose myself.
For example, I want to replace the values 1-6 with my own vector [10, 16, 53, 97, 136 191] so that they are displayed on the x- and/or y-axis.
Thanks!
1 Answer
You can modify the XTickLabel and YTickLabel properties for this.
In MATLAB r2014b or higher you should:
ax=gca; ax.XTickLabel = {'10', '16', '53', '97', '136', '191'}; ax.YTickLabel = {'10', '16', 'look a banana', '97', 'yeah you can write whatever', '191'}; In previous versions do
ax=gca; set(ax,'XTickLabel',{'10', '16', '53', '97', '136', '191'}) set(ax,'YTickLabel',{'10', '16', 'look a banana', '97', 'yeah you can write whatever', '191'}) More info: