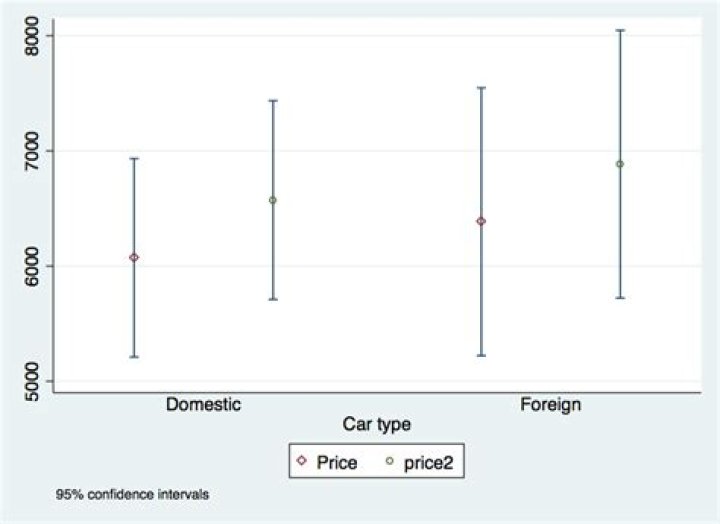
I would like to plot the means and confidence intervals of two variables into one graph. I used ciplot to do this for only one variable, but for two this code is not working.
On the internet I found that you could combine the plots as follows:
ciplot relative_ambition12 relative_ambition22, by(quota) However, if I run this I get the error:
no observations found
At the same time both of the following do produce graphs:
ciplot relative_ambition12, by(quota) ciplot relative_ambition22, by(quota) Does anyone know how I can combine these two graphs into one?
21 Answer
The community-contributed command ciplot expects to work on the same set of observations for all variables specified in varlist.
For example, the following works:
. sysuse auto, clear . generate price2 = price + 500 . ciplot price price2, by(foreign) 
However, the following does not:
. replace price2 = . if foreign == 1 . ciplot price price2, by(foreign) no observations r(2000); Both plots can be graphed separately (i.e. if one variable at a time is specified).
When you have different sets of observations, you can use the inclusive option to produce the desired output to the extent possible:
. ciplot price price2, by(foreign) inclusive