I have 1 table with multiple rows. It looks something like this:
------------------------------------------------ StoreId| PostingDate | SalesAmt MAIN | 2021-02-04 | 100 WEST | 2021-08-11 | 15 WEST | 2021-09-11 | 36 MAIN | 2021-11-11 | 78 MAIN | 2021-04-11 | 56 ------------------------------------------------ And soon and so forth...
Now I want to produce the following in the Power BI as Table:
-------------------------------------------- StoreId| YTD | MTD | WTD | TransactionCount | WEST |5,447| 800 | 74 | 1,475 | MAIN |4,500| 421 | 15 | 1,855 | -------------------------------------------- How can I achieve that? I am very new to this so I don't know how to do it. I have been reading DAX and Power Query but maybe DAX is suitable for this?
51 Answer
I assumed your data looks like this. I've added data for the year 2022. Also, I'm assuming there aren't future dates, the observations behave as transactions that happened in the past.
Table
| StoreID | PostingDate | SalesAmt |
|---|---|---|
| WEST | 16/01/2021 | 141 |
| MAIN | 24/01/2021 | 221 |
| WEST | 25/01/2021 | 119 |
| MAIN | 18/04/2021 | 209 |
| MAIN | 22/04/2021 | 220 |
| MAIN | 24/04/2021 | 167 |
| WEST | 16/11/2021 | 224 |
| WEST | 03/02/2022 | 155 |
| MAIN | 07/02/2022 | 236 |
| WEST | 11/02/2022 | 216 |
| WEST | 23/03/2022 | 135 |
| MAIN | 28/05/2022 | 153 |
| WEST | 01/06/2022 | 121 |
Calendar Table
For the calculations below to work, you need to create a calendar table. It goes from the first date of Table until today. If your calendar table is different the time intelligence function will not work.
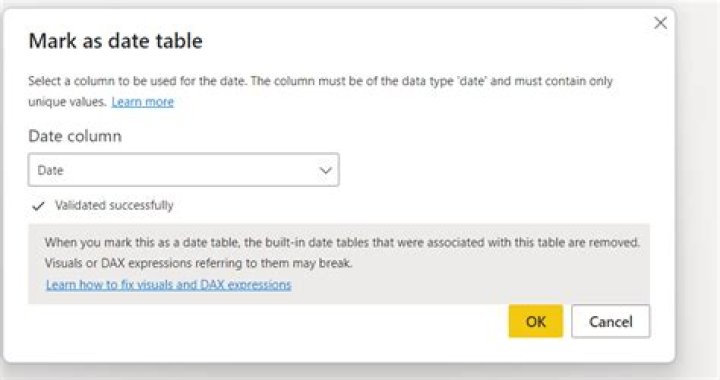
Calendar = CALENDAR(MIN('Table'[PostingDate]),TODAY()) And mark the Calendar table as a Date Table.

Sales Amount
Sales Amount = sum('Table'[SalesAmt]) WTD
Assumes your week starts on Monday.
WTD = VAR WeekStart = TODAY() - WEEKDAY(today(),2) RETURN CALCULATE([Sales Amount],'Table'[PostingDate]>=WeekStart) MTD:
MTD = TOTALMTD([Sales Amount],'Calendar'[Date]) YTD
YTD = TOTALYTD([Sales Amount],'Calendar'[Date])