I feel I am probably not thinking of something obvious. I want to put in the same figure, the box plot of every column of a dataframe, where on the x-axis I have the columns' names. In the seaborn.boxplot() this would be equal to groupby by every column.
In pandas I would do
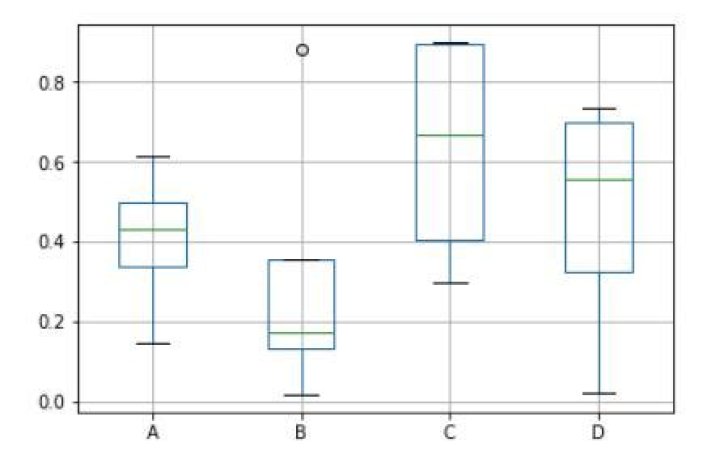
df = pd.DataFrame(data = np.random.random(size=(4,4)), columns = ['A','B','C','D']) df.boxplot() which yields

Now I would like to get the same thing in seaborn. But when I try sns.boxplot(df), I get only one grouped boxplot. How do I reproduce the same figure in seaborn?
3 Answers
The seaborn equivalent of
df.boxplot() is
sns.boxplot(x="variable", y="value", data=pd.melt(df)) or just
sns.boxplot(data=df) which will plot any column of numeric values, without converting the DataFrame from a wide to long format, using seaborn v0.11.1. This will create a single figure, with a separate boxplot for each column.
Complete example with melt:
import numpy as np; np.random.seed(42) import pandas as pd import matplotlib.pyplot as plt import seaborn as sns df = pd.DataFrame(data = np.random.random(size=(4,4)), columns = ['A','B','C','D']) sns.boxplot(x="variable", y="value", data=pd.melt(df)) plt.show()
This works because pd.melt converts a wide-form dataframe
A B C D 0 0.374540 0.950714 0.731994 0.598658 1 0.156019 0.155995 0.058084 0.866176 2 0.601115 0.708073 0.020584 0.969910 3 0.832443 0.212339 0.181825 0.183405 to long-form
variable value 0 A 0.374540 1 A 0.156019 2 A 0.601115 3 A 0.832443 4 B 0.950714 5 B 0.155995 6 B 0.708073 7 B 0.212339 8 C 0.731994 9 C 0.058084 10 C 0.020584 11 C 0.181825 12 D 0.598658 13 D 0.866176 14 D 0.969910 15 D 0.183405 You could use the built-in pandas method df.plot(kind='box') as suggested in this question.
I realize this answer will not help you if you have to use seaborn, but it may be useful for people with simpler requirements.
import numpy as np; np.random.seed(42) import pandas as pd import matplotlib.pyplot as plt df = pd.DataFrame(data = np.random.random(size=(4,4)), columns = ['A','B','C','D']) df.plot(kind='box') plt.show() plt.boxplot([df1,df2], boxprops=dict(color='red'), labels=['title 1','title 2'])