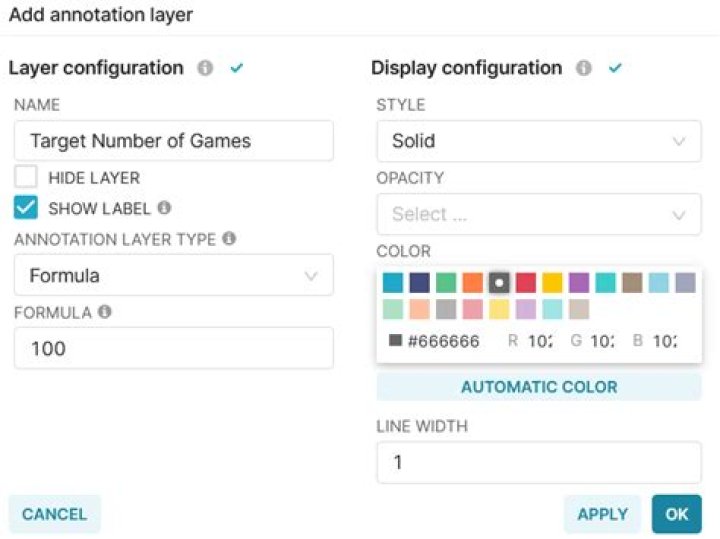
I see how to add a horizontal line to an Apache Superset chart, but can't figure out how to display the label on the chart. I want users to be able to see it without having to mouseover the chart.
Here's an example with the Games per Genre over time demo chart. My annotation:

That gets the line to display at 100, but its label - Target Number of Games - is not visible:
Is there a way to get the label to display just above or below its line?
1 Answer
Per a moderator in the Apache Superset Slack message board, this is not currently possible as of v1.5.0.